DISCOVERY
& RESEARCH

Strategy is what separates a report design that looks good from a report design that works, and has the impact intended.
Before designing, I need to be clear on:
When creative choices are made after getting this strategic base, the result is an industry-leading report design that is built for functionality and impact.
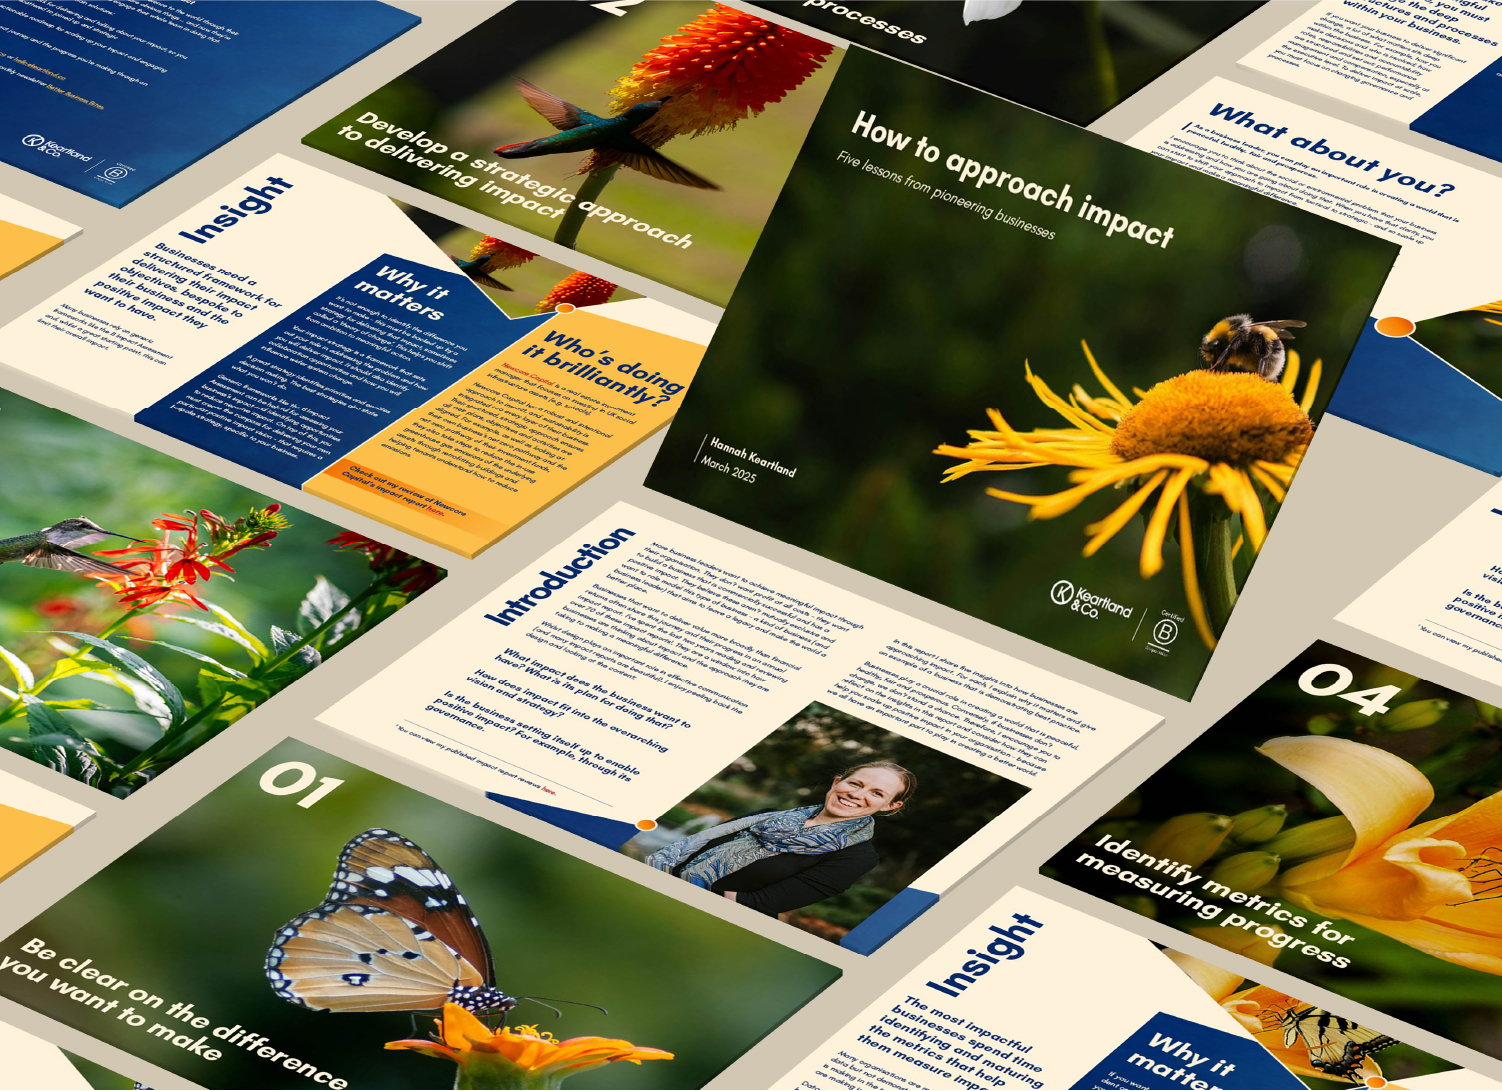
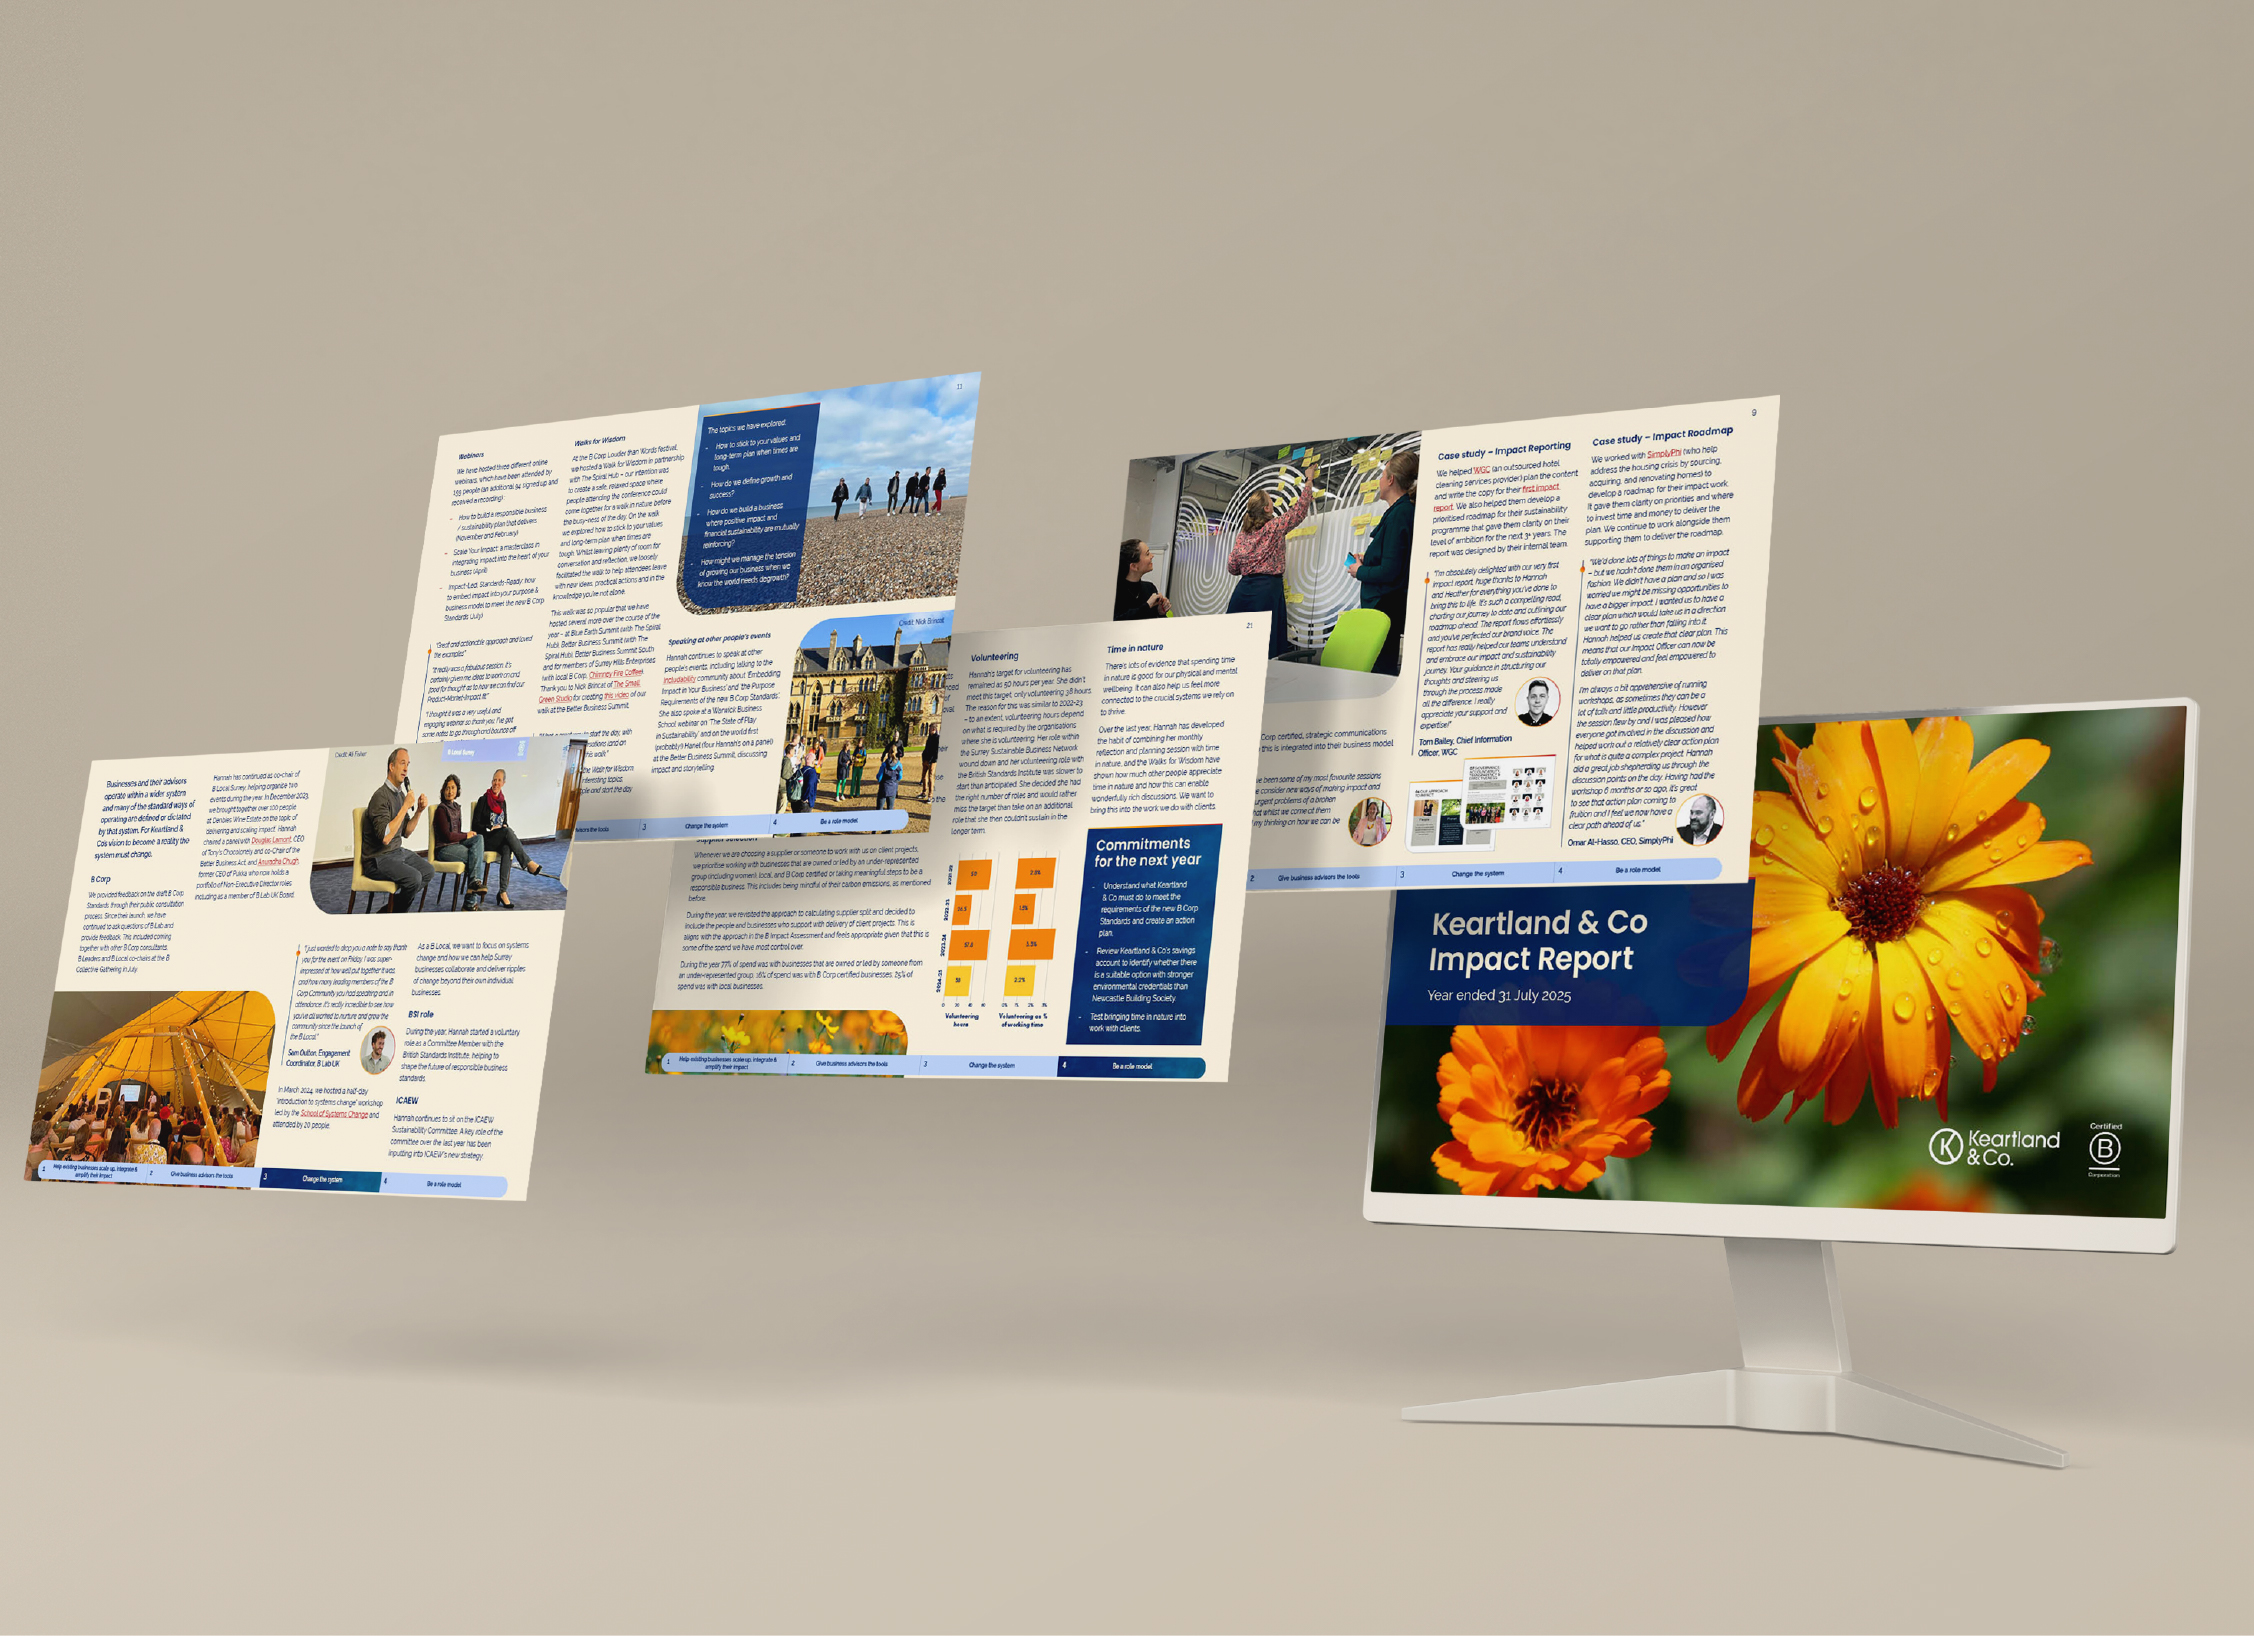
Keartland & Co now has four professionally designed reports it's proud to put in front of clients and partners; each one positioning the consultancy as a credible, considered voice in the impact space.
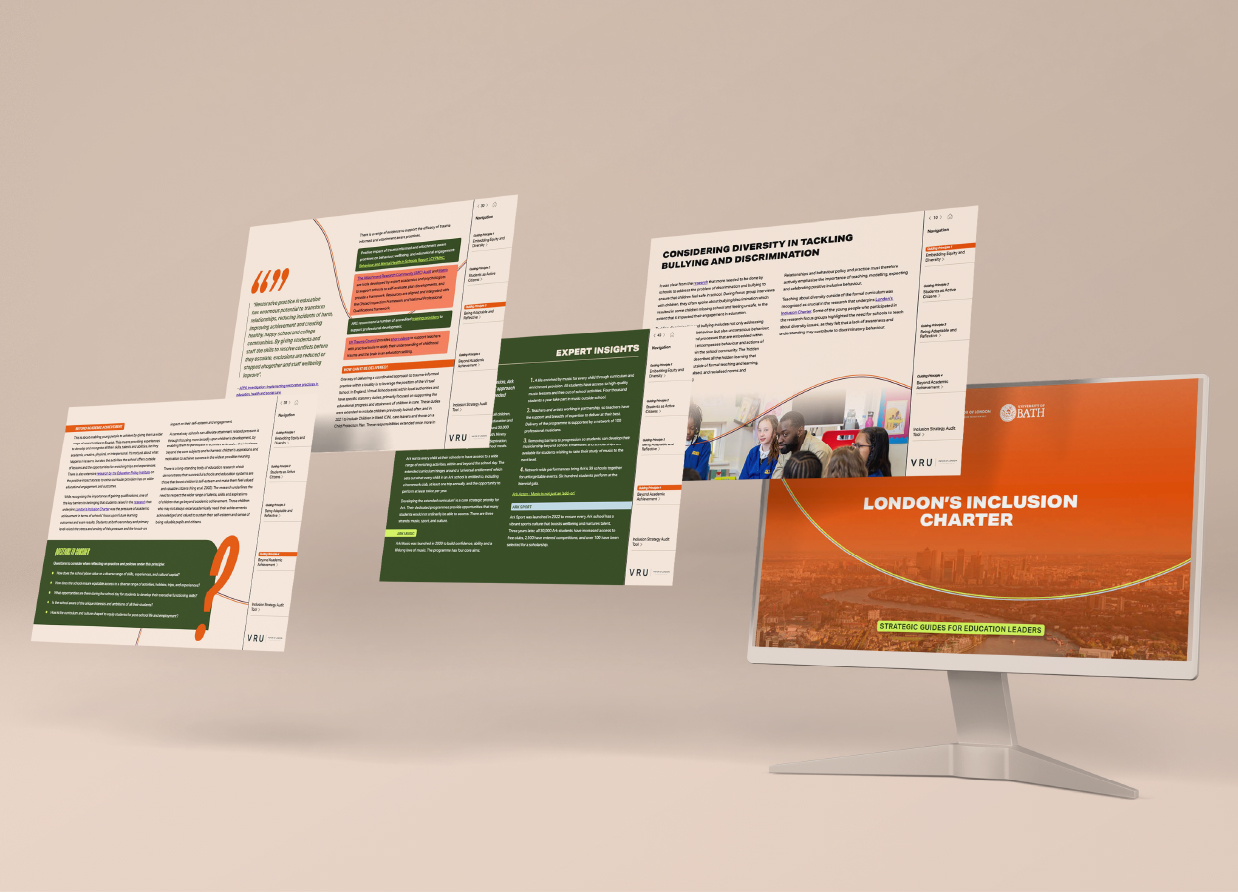
These Strategic Guides for education leaders were designed to support London's Inclusion Charter. The charter has now been adopted by 30 councils across the capital, with nearly every London borough now signed up to the Charter's commitment to tackling suspensions, exclusions, and absenteeism.
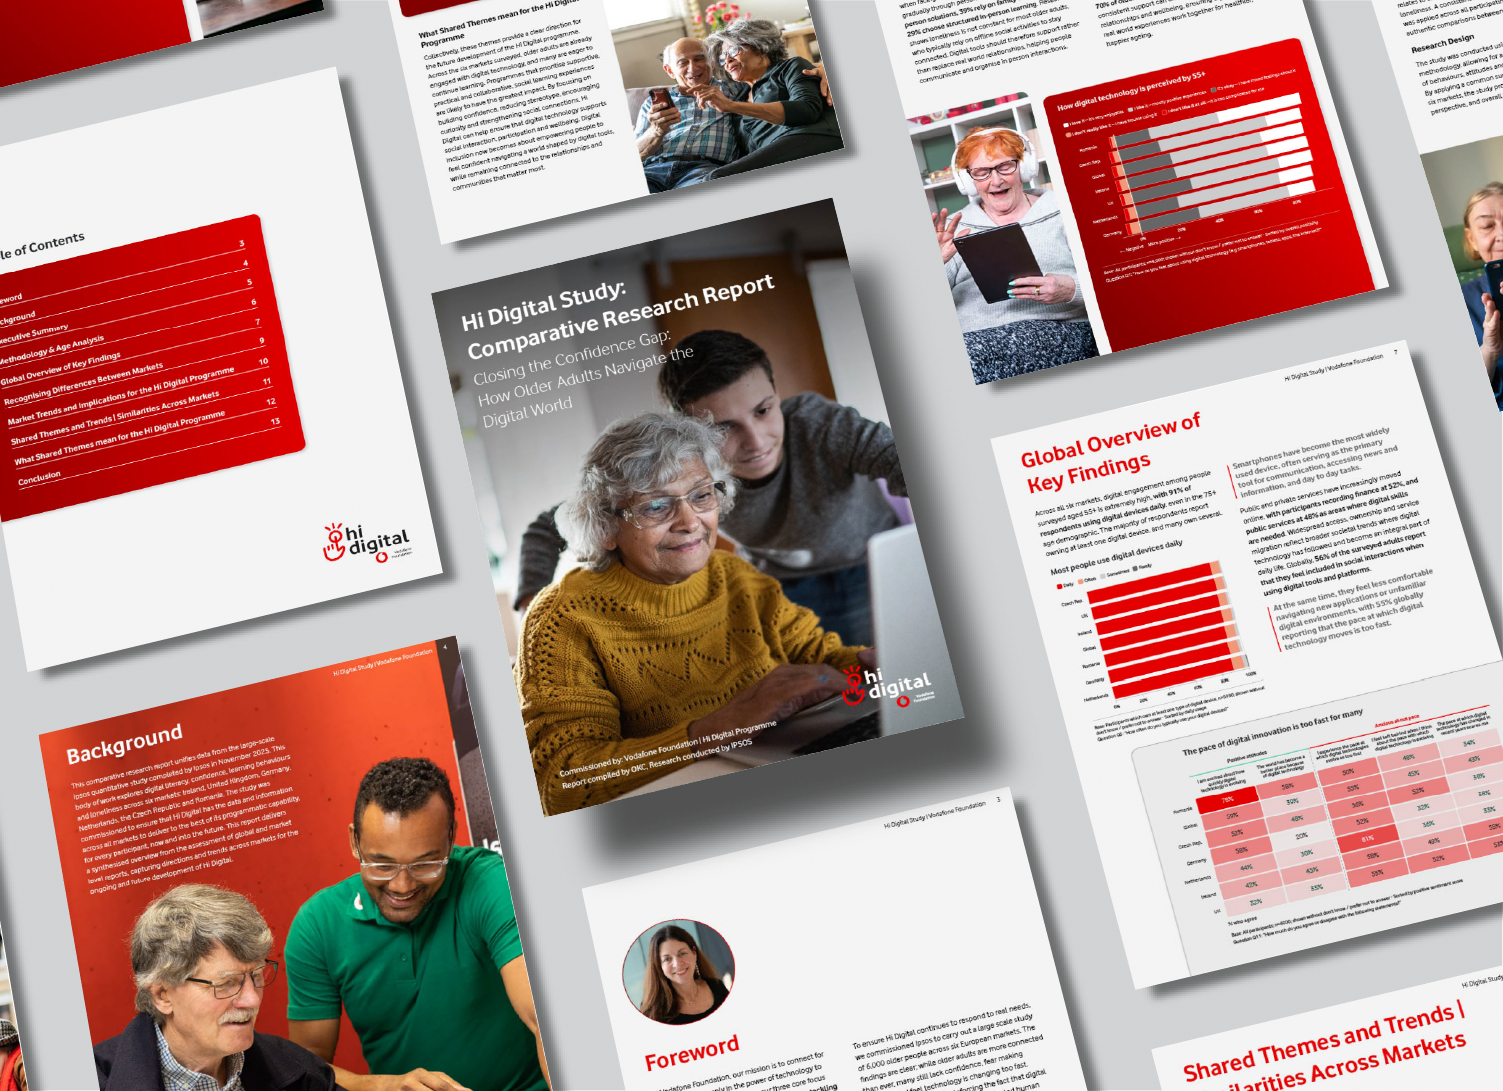
The Hi Digital report is now being used to inform the future direction of the programme across six European markets — shaping how the Foundation designs learning experiences, targets support, and makes the case to institutional partners for continued investment in digital inclusion.
Each report design project follows my same strategic process:
Across every project, a few things come up again and again in client feedback: